Project 1: Recipies
Released: 11:59 PM Sunday, May 31st, 2020.
Due: 11:59 PM Friday, June 19th 2020.
Calculating Pi using a computer simulation!
Introduction
Monte Carlo simulations: A method of estimating unknown quantities using a set of randomized samples.
Monte Carlo simulations are a useful tool to calculate very complex probabilities. But let’s look at a simple case. Imagine you are trying to calculate the probability of rolling a 6 using a die. Assuming the die is fair, it should be 1/6th but how could I calcluate that?
Well, using a Monte Carlo simulation, I could roll a die 10 times and count the number of 6’s I rolled. If 4 out of 10 rolls are a 6, then the probability will be approximately 4 divided by 10, 40%.
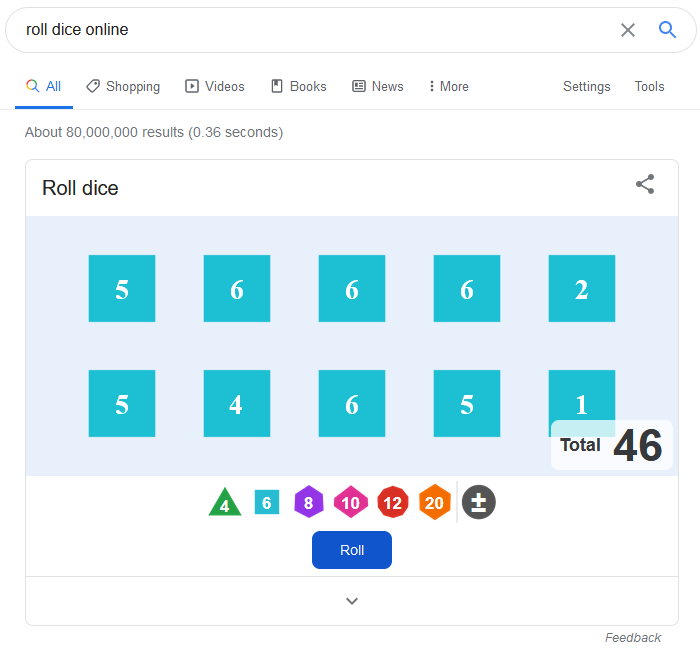
Well that doesn’t sound right… Unless the die isn’t fair! But this is easily explained by the number of rolls! If I roll only a couple of times, the count will not be accurate. For example, if I roll once and I get a 6, I cannot conclude that the probability is 100%. (Law of large numbers!)
Now if I roll a die 119 times! And 18 times out of those 119 I roll a 6, then 15% of times I got a 6. Thus, I got it a bit under 1/6th of the times. Now that makes sense! And the more I roll, the more accurate is my answer!
A cool application of this method, is to calculate Pi (the constant). Pi is one of the most well known constants! And it pops up everywhere! And albeit many different ways to calcluate Pi, one of the coolest ones (well, for me anyway) uses simulation. In particular, throwing darts randomly.
This is how it goes:
-
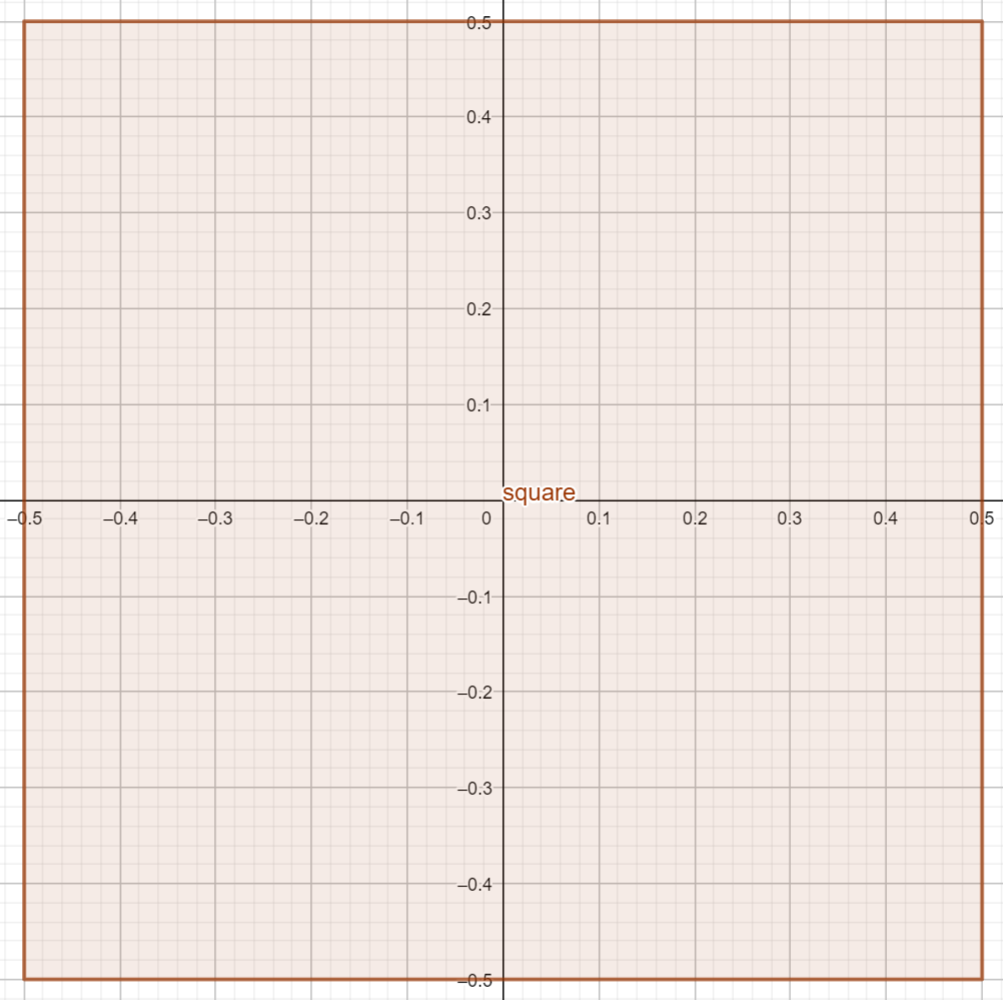
Draw a square with side \(s\) (in the examples \(s\) equals 1):
-
Draw a circle inside that square in such a way that its circumference touches all sides
(radius \(r = \frac{s}{2}\) = 0.5 in the example):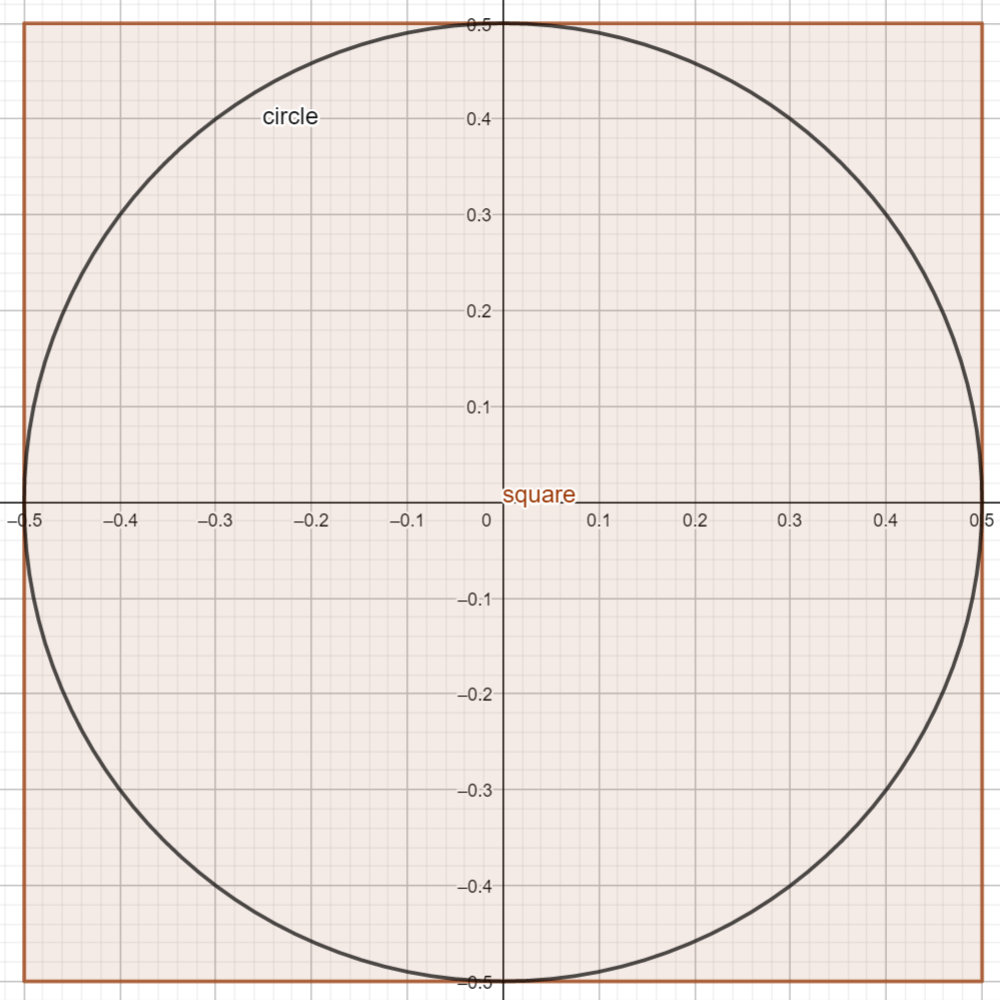
-
Now throw darts randomly and uniformely at the square:

-
Count the number of darts that hit the circle.
Assuming you can actually hit the target uniformely, the number of darts that hit the circle (\(n_{circle}\)) divided by the number of darts that hit the square (\(n_{square}\)) should be proportional to the area of the circle (\(A_{circle}\)) divided by the area of the square (\(A_{square}\)).
\[\frac{n_{circle}}{n_{square}} \sim \frac{A_{circle}}{A_{square}}\]The Area of a square of side \(s\) is calculated with the formula:
\[A_{square} = s^2\]And the area of a circle of radius \(r\) is calculated with the formula:
\[A_{circle} = \pi r^2\]Because our radius \(r = \frac{s}{2}\)
\[A_{circle} = \pi \left(\frac{s}{2}\right)^2= \pi \frac{s^2}{4}\]Thus the ratio of the areas is:
\[\frac{A_{circle}}{A_{square}} = \frac{\pi \frac{s^2}{4}}{s^2} = \frac{\pi s^2}{4s^2} = \frac{\pi}{4}\]Thus:
\[\frac{n_{circle}}{n_{square}} \sim \frac{\pi}{4}\]And if we multiply both sides by 4:
\[4\times \frac{n_{circle}}{n_{square}} \simeq \pi\]Check this video for the actual dart experiment, but we will be simulting this experiment with a Java program!
Solution
You will be implementing this project in three different labs.
Submission
Submit a single ZIP file with your project named username_proj1.zip (e.g. lun8_proj1.zip). In the zip file, there should be no folder!, just the following files:
- Your Project1.java file. Put your name and username at the top of the file in comments!
-
A
readme.txtfile. It should contain:- Your name
- Your Pitt username
- Anything that does not work
- If you attempted the extra credit
- Anything else you think might help grading your project more easily
Submit into the submissions Box folder I have shared with you. Your Box folder (you have 50GB!) is accessible through http://my.pitt.edu. When you see your file within the shared folder, you know you have uploaded it successfully. If you would like to resubmit, you can copy the file in again. Let me know immediately if there are any problems submitting your work.